SBC Insight: Understanding your strike-rate & the losing runs that go with it – Essential punting advice

Without doubt one of the biggest barriers to making your betting a success is learning how to deal with the psychological challenges that it can bring – especially when it comes to the dreaded losing run.

We have all been on them – those runs where you can’t see where your next winner is coming from.

The type that see you constantly topping up your bookmaker account and the feeling you are hemorrhaging money.

It’s why 2 punters who start following the same tipster can often end up with very different results. Often because during a losing run, one of them quits in reaction to a short-term run of form.

There is no shame in this – after all the emotion of betting can be very hard to handle, especially when you are expecting to make a profit and yet you keep losing.

Yet there is a way to get through them – simply by having a better understanding of some fundamentals that underpin value betting such as your strike-rate.

Learning About Losing Runs

To help you understand more on this topic, I want to share with you below a tremendous article as published by Steve Jones of the CD Systems service. It serves to educate you on strike-rates and how they can guide you as per losing runs and what to expect.

For example, a tipster service with a 49% strike-rate has a 50/50 chance of hitting 10 losers on the bounce over a 650 bet period.

Most services hitting such a strike-rate will likely advise bets between say 11/10 and 11/8, so how likely are you to stay the course if you backed 10 losers in sequence at odds of 11/8?

Many people during such a sequence would throw in the towel, yet this is not always the wisest move.

This article is one I return to again and again, especially during the dark days of betting when I can’t see where my next winner is coming. Because no-one is immune to bad runs, yet how we handle and react to them is vitally important.

And despite what you might think – just because you pay for tips, it doesn’t mean they will lose less. The fundamentals of probability remain the same, yet if these tips are based on a ‘value betting strategy’ with an edge, long-term it will reap dividends.

My thanks to Steve for giving me permission to share this article and I hope you enjoy it. You can read more about Steve and his services at the CD Systems website.

For further insight – Steve also recommends spending 20 minutes or so at https://justflipacoin.com and recording the sequences generated by random even-money spins. The results will surprise many and would need to be fully understood by anyone seriously intending to embark on a lengthy series of short-priced bets.

Don’t Go Broke! Understanding Losing Runs

Reproduced with permission – see the original at http://www.cdsystems.uk.com/dont_go_broke!.htm

One of the quickest ways to disaster is to be ignorant about losing sequences. They can occur without warning at any time, and they can quickly devastate a betting bank if it is of insufficient size to absorb them.

First of all, how do you know what the length of these losing sequences is likely to be? Well actually, that is fairly easy to predict, provided you have an accurate idea of your strike rate.

Sequences are directly related to strike rate, and you can mathematically determine the likelihood of specific sequences appearing, provided you know what percentage of the bets in a series are going to win. You can then use this criteria to set up your betting bank.

My view is that the size of your opening bank should equal the longest losing sequence you could encounter during an extended series of bets, multiplied by your maximum stake.

To illustrate, I have produced the table below, which you can use to determine your staking strategy. Let’s say, for example, you estimate that your strike rate over a series of 600 bets will be around 40%.

Please note at this stage that there are no ‘good’ or ‘bad’ strike rates – they are all purely relative to the price range you decide to target – please refer to my article How Many Winners? in conjunction with this procedure (opens in a new window).

Use Your Strike-Rate To Determine Losing Runs

As can be seen from the table below, with a 40% strike rate you can expect to have a losing sequence of 10 somewhere in the series (there is a 75% chance of that happening). However, there is a 50% chance of your hitting a losing sequence of 12 and a 25% chance of a run of 14 losers. That sequence of 14 is less than likely to occur, but it will still happen, on average, once in every four series.

On the other side of the coin, you have a 75% chance of hitting at least one winning run of 6 during the series. A sequence of 7 is a 50:50 possibility and a successful run of 8 has a 25% chance of occurring. Those figures can be seen in the 60% row (take your strike rate away from 100 and look in the row for the difference in order to anticipate winning sequences).

Finally, with a less than 1% chance, you are likely to confront a losing sequence of 20 no more often than once in every hundred series. However, that is the figure you should use in constructing your betting bank. If you are to operate professionally that is what you must do.

Using the formula I mentioned earlier, you would multiply the longest losing sequence you could encounter during the series (in the above example that would be 20) by your maximum stake. If that is, say, 5 points, then your starting bank should be 100 points.

Losing Runs Happen To Everyone

Please don’t make the common mistake of thinking these sequences won’t happen to you. They are mathematically determined by your strike rate and will happen as often as they are entitled to, whether you like it or not. Nobody can avoid them, but the difference between a professional and an amateur is that the professional is fully prepared for them. When they do occur it certainly doesn’t mean that you are ‘out of form’ or doing anything wrong.

It is also recommended that you set aside a reserve bank which can be used to temporarily top up the main bank in extreme circumstances. For example, a downturn which is over and above any which had originally been catered for (perhaps the original strike rate calculation was based on insufficient data and needs amending).

Once you have accurately anticipated your strike rate, you will be able to use the table below to optimise your bank structure.

Provided the average price of your winners is sufficient for your strike rate, as explained in How Many Winners?, and your bank is set up in such a way as to absorb sequences, then you will never have a problem. You will be well on your way to securing a successful future in a professional manner.


Anticipation of Sequences – Table

Please note: The table below is based on a series of between 600 and 650 bets. A shorter series would be less likely to contain sequences as long as these and a longer series would be more likely.


Strike Rate

(%)

Anticipation of Sequences
Expected

(75% chance)

50:50

(50% chance)

Unlikely

(25% chance)

V. Unlikely

(<1% chance)

383105132235
46986106185
5597390153
6526478130
7465768113
8425161101
938475691
1035435182
1133404775
1230374469
1329344164
1427323860
1525303656
1624293453
1723273250
1822263047
1921252945
2020242842
2119232640
2218222539
2317212437
2417202335
2516192234
2615192133
2715182131
2814172030
2914171929
3013161928
3113161827
3212151726
3312151725
3412141624
3511141624
3611131523
3711131522
3810131521
3910121421
4010121420
419121320
429111319
439111319
449111218
458111218
468101217
478101117
488101116
498101116
50791115
51791015
52791015
53791014
54781014
5568914
5668913
5768913
5868913
5968912
6067812
6157812
6257811
6357811
6457811
6557711
6656710
6756710
6856710
6946710
704679
714669
724669
734569
744568
754568
764568
773568
783558
793557
803557
813457
823457
833457
843456
853446
863446
872446
882446
892445
902345


I hope you enjoyed this article – if you have any feedback on it, please do share your thoughts with me via email – pete@smartbettingclub.com

Best Regards

Peter Ling

Smart Betting Club Owner and Founder


Deeper Betting Knowledge: Why understanding your ‘risk profile’ can make such a difference to your punting profits

It is fair to say that wherever you look now, betting is becoming more and more prominent in our society. Bookmakers are heavily involved in all major sports, especially so in the field of sponsorship and the increase of sporting coverage in the media has only heightened interest across the board in betting.

What hasn’t changed though are the risks involved in betting and how we as humans understand this and are affected by it. Nor the immutable rules of investment such as the fact that anything promising you a high reward almost always comes at a higher risk.

It is therefore important that we understand risk and how we as humans react to it.

Yet most crucially of all from a betting point of view – how we can calculate our own risk profile and how that should inform the way we bet and the tipsters we follow.

Understanding Your Risk Profile

Each of us has our own thoughts on the level of risk we take in our day to day lives. What we term your risk profile.

Are you for example, happy to risk speeding while driving as you calculate the chances of getting caught to be slim?

Alternatively, perhaps you prefer to drive within the speed limit to completely rule out the chances of attracting the long arm of the law.

If you do speed, how often and how far above the speed limit are you willing to risk on a fine or losing your licence? Are you happy to go 5%, 10% or even 20% over the limit?

We very often take these risk decisions and many others every day in our lives without realising.

Whether it be our speed driving or even in today’s coronavirus impacted world – when and how often we go outside and if we wear a mask when doing so. These decisions all feed from our in-built risk profile.

Therefore understanding risk and our perception of it is also especially important to those of us who gamble successfully.

If your approach to betting isn’t compatible with your risk profile, then chances are at some point it will cause you to fail or lose money.

The ‘Risky’ Tipster Promising +30% ROI  & Who They Suit

Through the Smart Betting Club and the tipsters we review and recommend, we see plenty of examples of the different types of risk that are open to us when betting.

So to highlight this we publish several different ratings that rank those at both ends of the risk spectrum for our members to note.

For example, there are those higher risk experts who put up betting tips at large prices, who offer high rewards, yet come with the risk of large losing runs or drawdowns at differing points in time.

These high risk tipsters can be very testing when following especially for those of you who might have a risk-averse risk profile.

As ever, that immutable law of investment rings true – high reward investments come at a high risk.

Take for example our recent review of a very profitable racing tipsterThis is a service who over 1200 bets had made a profit of 389.77 points @ 30.19% ROI at advised prices. An exceptionally fine record.

Most people will immediately note the extremely high ROI at over 30% and be attracted to it – yet it is vitally important to explore the facts behind the service to check whether it is suitable for you or not. As for some people, it will be simply too volatile a follow for their risk profile

As we get into the figures behind the profits, what is notable about this service is that it tips up bigger priced selections at an average price of around 14/1 and attains a strike-rate of approximately 14.14%. Just over 1 in 8 tips win.

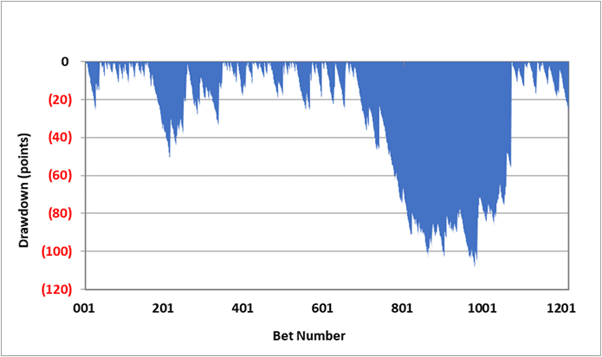
So, whilst this service has made an extremely high ROI at 30% ROI, it also had endured some bad losing runs at time, as indicated by the drawdown graph below. This highlights the depth of each bad run the service has suffered, which have pushed just beyond 100 points at one point.

So if you were someone considered to be risk-averse, there is every chance that if you had joined at the onset of any of these bad runs – possibly the drawdown in excess of 100 points, you would have quit before it could recover.

And it is important to state that this tipster did recover from this bad run, and the profits have since continued, but it took time and patience to do so. Something those of you risk-averse might not be comfortable with.


How to Evaluate Your Approach To Risk

The good news is there are several ways to work out your risk profile and tolerance including some simple tests we provide to Smart Betting Club members on how to calculate where they stand.

Yet if you are keen to work out your risk profile, you might want to see how many of the following, if any, apply to you:

  • You get upset easily after short term losing runs
  • You quickly give up if something starts losing
  • You don’t handle losing money very easily
  • Your moods are impacted by losing runs and losing money
  • You feel if paying for tips they should not lose regularly
  • You feel the need to win money every week/month

If any of the above ring true, then you may well be a candidate to take a more risk-averse approach and to step away from any tipster, system or strategy that has a low strike-rate of success.

If however…

  • You can stick out long losing runs
  • You can lose money and not be upset by this
  • You understand that you may not win every day/week or month
  • You understand that anything with high reward comes at high risk
  • You are happy to take a chance and speculate.

Then you may well be more suitable to a low strike rate, more long-term type of tipster that offers a higher reward in exchange for higher risk.

Using SBC’s Ratings To Help Calculate The Risk Of Any Tipster

To help you calculate the level of risk involved with any given tipster, we provide several different risk related ratings when reviewing a service.

For example, our simple risk rating works on a scale of 1-5 and is updated every few months for each tipster we monitor.

  • A risk rating of 1 indicates a very high risk tipster and one that will be suitable to those of you who have an extremely aggressive risk profile.
  • A risk rating of 5 indicates a very low risk tipster and one that will be suitable to those of you who have an extremely conservative risk profile.

Beyond that we also provide several other more detailed ratings that relate to risk as follows:

  • Patience: Expressed as per the length of time you need to commit to following a tipster to ensure a profitable return. Those with patience ratings 12 months and beyond can be considered higher risk as if you join at the wrong time (which no-one can predict) then you might well need to be very patient.
  • Risk Reward Ratio – This is a simple rating that accurately reflects the level of risk versus the rewards of following any given tipster.
  • Capital Risk Ratio – A simple percentage figure illustrating the size of betting bank lost during the worst run any tipster has endured. The higher figure lost the greater the risk.
  • Dispersion Factor Rating – This rating takes out the top and bottom 5% of results and those that might be considered outliers or ‘freak results’. The ensuing rating outlines just how risky a tipster will be to follow.

Ignore Your Risk Preferences at Your Peril!

Perhaps the biggest risk that you can take is to ignore this area altogether and simply ‘cross that bridge when you come to it’.

You really need to act and understand this area because if you make choices that are incompatible with your risk profile and tolerance, it could set you back a long way.

Failure to bet in a way that is compatible with your risk profile could cost you in the form of lost winnings, extra losses and even unused subscription fees if you choose to follow tipsters.

If you are interested in learning more on your risk profile, then as an SBC member, you can access a detailed guide to the topic including some simple tests to calculate where you stand when it comes to risk. And of course – all SBC reviews also come with various risk ratings as standard to help you identify the right tipsters to fit you!

Join The Smart Betting Club and take advantage of our lowest EVER membership prices for 2020.

The good news is that from as little as £27.99 + VAT per quarter, you can get started immediately and access the ENTIRE Smart Betting Club service including all our SBC Magazines (including detailed tipster reviews), Tipster Profit Reports, Free Tipsters, Advanced Tipster Analytics, Betting Insight Articles, Pro Betting Guides & more.

This includes access to our full 14 year back catalogue and no quibble money back guarantee if you join and don’t like what is on offer (unlikely!).

£27.99 per quarter works out at just £2.15 per week. Subscribe NOW to the Smart Betting Club and gain instant access

Best regards

Peter Ling

Smart Betting Club Owner and Founder


Deeper Betting Knowledge Part 2: Using Monte Carlo Simulations To Evaluate Tipsters

Welcome back to the 2nd part of our look at the 12 Advanced Tipster Outputs we now publish in every SBC Tipster Review and how they can help reveal the best, most reliable tipsters.

If you missed Part 1, you can read it on the SBC Blog via this link.

Otherwise strap in for outputs 5 to 12, what they are and what they tell us about a tipster service…

5) 50th Percentile Drawdown

This is obtained by the same method as that in the 99th percentile drawdown (#4 in part 1), although on this occasion, we look at the 50th percentile, This calculation indicates there is a 50% chance, i.e. even money, of a losing run in any given year to the current staking plan.

It indicates that, if a service is followed for two years, a bettor should absolutely expect to suffer a drawdown of this size at some point.

What To Look For: A figure that is absorbed by the suggested betting bank as we can expect this run to happen once every 2 years. Again, it’s useful for you as a punter as you might want to avoid services with big drawdowns likely to occur at least once every 2 years.

Recent Examples: One tipster provided quite a severe example of this in action as we discovered that their 50% percentile drawdown figure was a staggering 111% of the suggested betting bank (as put forward by the tipster themselves). Clearly this was inadequate and if following the tipsters bank suggestion, you should expect to go bust once every 2 years. It was no surprise this tipster did not receive a strong rating from the SBC team.

6) 50% Bankroll Drawdown

Description: The result of this calculation, also known as the ‘semi-ruination’ figure, indicates how often one is likely to avoid a drop that eats half of the funds set aside for betting with a service.

It is a widely-held belief that some considerable resolve and confidence is required once you lose half of your betting bank. At the point that 50% of your bank goes, most people would quit.

What To Look For: The higher the percentile that this output gives, the better and the less likely one is to have to contend with such a 50% dip.

Recent Examples: One extreme example of a service with a poor 50% bankroll drawdown figure came in a review of a racing tipster from 2019, which indicated you should expect to see a peak-to-trough drop of this size in 82% of all years. Effectively meaning that every 4 out of 5 years you would lose half your bank and helping to highlight a very volatile service.

7) Likelihood of a Losing Year

Description: A percentage figure that indicates how likely you are to suffer a losing year.

What To Look For: The lower the figure the better – especially for those of you who expect to play it ‘safe’.

Recent Examples: The extensive simulations that we have run during the last year show one top rated SBC Hall of Fame racing tipster to have the lowest probability of a losing year. In fact, our Monte Carlo simulator ran 5000 seasons covering almost 28m bets and not one losing year was encountered!

The highest probability recorded was just over 49% by a poorly rated racing service. This meant that a loss should be expected every other year if following and it is of little surprise that this service ended a few months after our analysis.

8) Risk Reward Ratio

Description: This ratio is obtained by taking the average annual profit divided by the average annual drawdown over the period of the review.

What To Look For: The higher the number the better and for no huge disparity between the live and simulation results.

Recent Examples: Anything above a score of 2 can be regarded in a positive light (classed as ‘excellent’) and several recent tipsters all achieve this with a very high score for one racing service who hit a mark of 3.427..

9) Capital Risk Ratio

Description: The Capital Risk ratio is a simple calculation that represents the percentage of the bankroll consumed by the maximum drawdown suffered.

What To Look For: The lower the number the better and again parallels between the tipster’s live results and simulation results are welcome.

Recent Examples: If a tipster’s largest drop is less than one-third (33%) of their recommended bank, then this wins a rating of ‘excellent’. A score of more than 66% is a concern and noted as ‘poor’ and, again, intermediate figures are labelled as ‘strong’ and ‘average’.

A recent NFL tipster we reviewed leads the way in this exercise with a ratio of 17.20% with several others all featuring around the 22% mark. These all constitute an excellent Capital Risk Ratio score.

10) Dispersion Factor

Description: The dispersion factor indicates the degree of instability or uncertainty that should be expected when following a tipster. We use the simulations to produce best and worse-case strike-rates, disregarding the top and bottom 5% of results.The dispersion factor is the ‘near-best’ figure divided by the ‘near worst’, i.e. taking the 95th and 5th percentiles.

This output is routinely used to remove the outliers or freak results such as a one-off 200/1 winner or others that vary from the norm.

What To Look For: The lower the factor, the less volatile the tipster should be.

Recent Examples: A recent SBC review tackled a tipster with an excellent ROI of over 30%, but as one targeting bets at over 10/1, it can be a volatile service to follow. This is reflected by the fact they have a dispersion factor rating of 1.796, which is rated as ‘high’.

This follows the accepted wisdom that any investment with a high reward, for example a ROI of over 30%, comes at a high risk.

11) Sharpe Ratio

Description: This is a relatively new index that we have introduced into our analysis work to provide a measure with which we can compare a tipster’s annual betting bank growth.

It compares this growth against the UK’s average ‘risk-free’ investment rate over the review period. Effectively – what kind of interest rate you might enjoy if putting your money in guaranteed sources such as a bank savings account or a government bond. The risk-free rate has been consistent over the last few years at around 2.1% (although may admittedly be changing in this current climate). The ratio is the average ROC returned in excess of this figure.

What To Look For: The higher the number the better. It is also a good examination of what you can make in comparison to other savings options out there.

12) P-Value

Description: An incredibly useful output, the p-value is a statistical test to evaluate the probability of obtaining a set of results by chance (as opposed to skill). It is obtained from an algorithm that uses three variables: overall strike rate, ROI and the average odds of all selections.

What To Look For: The lower the number the better and as close to 0 as possible. A high number indicates either a lack of live data or a set of results that might be based on luck.

Recent Examples: ‘Low’ probability covers the range between 0 and 0.025, whilst a result of between 0.025 and 0.05 is seen as ‘moderate’, with p-values in excess of this being taken as ‘high’. To complete the picture, a p-value of 1 would indicate absolute certainty that the results have been obtained by pure chance alone.

Several strongly rated tipsters we have reviewed recently had p-values of zero, which suggest that the results obtained were 100% based on skill and there is no luck element to be found. There are also numerous other tipsters that have gone under our result microscope, each of whom had very low p-value scores.

Those with higher p-value scores are usually those tipsters either targeting bigger priced selections OR those with smaller data sets than we would like. For example, one promising golf tipster had a high p-value of 0.3130 as he had put up less than 600 tips over 3 years and at a strike-rate of 20.54%. Highlighting this as a tipster or promise, yet one we clearly need more data for before rushing to invest our money in his advice.

High scores could, but not necessarily, indicate that a tipster has changed methodology of selection during the review period and this is something we would test with the tipster.

Advanced Tipster Analytics Wrap

I do hope you have enjoyed this special 2-part guide on these Advanced Tipster Outputs and just how they can help you discover more about betting services.

They go further than simply evaluating which tipsters are good or not, but into other key areas such as losing runs, bank sizes and the level of risk if following them in.

All these outputs are important so you can fully understand which tipsters you should follow and those that suit your personality.

If you want to know more, then you can explore the full Advanced Tipster Analytics Guide with a Smart Betting Club membership. Best of all – you can read the 12 scores and ratings for each tipster we review based on the Monte Carlo Simulations we perform as standard.

All of which are designed to give you every bit of information to help you choose the best tipster services for you!

SBC Helping Inform Your Betting Over The Next Few Months

Whilst there isn’t a huge amount for us to bet on right now, we are using this quiet betting period to publish a series of quality reviews, articles and insightful guides to help deepen the expertise of SBC members.

Mindful of the fact that many of you are using this time without sport to improve your knowledge and understanding of the betting and tipster world, our role is to help fill that gap with informative, educational and quality content.

Tackling everything from helping develop and understand your betting risk profile, the psychology of a winner, Advanced Tipster Analytics and guides to betting on new sports, you can expect to read a lot as an SBC member over the next few months.

As ever, membership comes with a full 30 or 90 day money back guarantee, so if you are looking to develop your betting skills, do consider a Smart Betting Club subscription.

Best regards

Peter Ling

Smart Betting Club Owner and Founder


Deeper Betting Knowledge Part 1: A Guide to Using Monte Carlo Simulations To Evaluate Tipsters

In these quiet times for sport and betting, it’s an ideal time to look to develop our knowledge and skill sets and as part of that, in this new 2-part series I want to walk you through how to use Monte Carlo simulations to evaluate tipsters.

Much of this work has been ported over from other investment worlds and the outputs provided help us make more informed decisions on just which tipsters offer the best chance to make you a profit betting.

The full SBC Advanced Tipster Analytics Guide on Monte Carlo Simulations and the outputs for each tipster are available to full SBC members, yet in this 2-part article, I want to outline what they are and how exactly they can help when evaluating a tipster.

The good news is that you DO NOT need to understand any complicated mathematics to benefit from exploring these advanced outputs. Simply follow the easy to understand explanations we give and the context and scores we put the ratings in.

These advanced analytics are ideal if you are interested in topics like losing runs, risk, whether a tipster is lucky or skilful, comparison to other investment returns and volatility.

Over the course of this 2-part article as well as explaining the usage of Monte Carlo simulations behind the analytics, I will also be explaining the outputs they provide, which include:

  • Historical maximum drawdowns
  • 99th and 50th percentile drawdowns
  • 50% bankroll drawdowns
  • Likelihood of a losing year
  • Risk reward & Capital risk ratios
  • Dispersion factor
  • Sharpe ratio
  • P-values

If this all sounds complex – don’t worry it isn’t and please don’t stop reading!! You honestly don’t need a degree in maths to figure out how they can help you.

Instead let me guide you through each of them and explain what they are and how they can help you make better decisions for choosing the tipsters you follow.

Introducing Monte Carlo Simulations

When the SBC team reviews a tipster, the first port of call is to explore the live record of performance obtained to date. Usually this encompasses at least a couple of years data, if not more and often at least 1000 to 2000 past actual bets.

As useful as it is to explore this live actual record of performance, from an analysis perspective, the amount of data we have – even if 2000 bets is often insufficient to draw 100% concrete conclusions from.

This is where running Monte Carlo simulations for each tipster comes in as they replicate the profile of the service over many million data points.

So rather than calculate what might happen when analysing 1000 or 2000 live bets, we do so over say 90 million – a much more useful data set.

The results of each Monte Carlo simulation can help to answer key questions for any given tipster such as:

  • Is a betting record more likely to be based on luck or skill?
  • What kind of losing runs or drawdowns might you realistically expect?
  • How do their live results compare to their simulation results?
  • Have they benefited from some freak results and outliers that are unlikely to be replicated?
  • What size betting bank do you REALLY need?

Ultimately, all the outputs from these simulations helps to give us a greater understanding of the quality of any given tipster. Certainly, it is far more useful than just scrutinizing the live results only.

All SBC reviews now include the results from our Monte Carlo simulator outputs as standard, hence why I wanted to illustrate what they mean and how you can interpret them in this special 2 part article.

How These Simulations Work

Monte Carlo simulations have existed in several forms for around 90 years and have been used in many walks of life such as medicine, insurance, space, oil exploration, nuclear weapon experimentation and even for general election modelling!

The simulation is a mathematical technique which is used to understand the impact of risk and uncertainty.

The main principle is the application of randomness and volatility to test theories of probability.

They are absolutely ideal for evaluating historic betting patterns and to predict best and worst-case scenarios.

When we at the SBC take a tipster’s proofed selections and provide statistical analyses by, for instance, season, month, course, race type and odds banding, we augment this by taking several copies of the key data fields and then modelling these through a computer algorithm which generates ‘virtual seasons’ each of the mean number of bets.

Typically, this might create, say, 100,000 seasons which could produce in the region of 90 million bets!

The greater the number of simulations that are run, the more confident and positive one can be of the accuracy of the outcomes.

It often takes 5-6 hours to run these Monte Carlo simulations for each tipster and a fair bit of processing power to get there but the results are often well worth the wait!

12 Outputs to Rate Tipsters By

By running the Monte Carlo simulations against each tipster analysed and reviewed, we are able to produce detailed results that provide a number of very useful outputs – 12 in total.

Over this 2 point guide, I will provide a description of each output with our reasoning as to why they are useful analytical tools and their application, together with some worked examples from our recent investigations showing how you can use them to make better decisions.

1) Strike Rate

This first output is a simple one as the strike rate is simply the overall number of winners divided by the tips given, expressed as a percentage.

What To Look For: Whilst there is isn’t really a ‘good’ or ‘bad’ strike-rate, this output is important as those tipsters with a lower strike-rate often require more patience, yet bring higher rewards and vice versa.

2) Return on Investment (ROI)

Another standard output whereby the ROI indicates the actual profit as a percentage of total stakes. ROI is always useful as it puts profit into context.

What To Look For: The type of ROI you can make often varies based on the strike-rate and the type of sport the tipster specialises in.

It isn’t rare to see a top racing tipster hit 30% ROI+ (caveated by the issues of getting on) vs that from a football tipster, whereby anyone making 5% ROI+ is doing very well (caveated by the fact it’s often much easier to get your bets on).

Therefore, the ROI needs to be judged in context against the markets tackled and the profile of tipster.

3) Historical Maximum Drawdown

Moving onto the first of the more advanced outputs and it’s important to understand what a drawdown is as this is a term we use regularly.

A drawdown is quite simply the worst historical run that has ever taken place – the peak-to-trough decline in bankroll experienced over a period of bets.

What To Look For: A tipster service with a strong record will have a historical maximum drawdown that is easily absorbed by the betting bank suggested. It’s a useful output to examine as if you struggle with long losing runs, you want to avoid tipsters that suffer occasional large drawdowns.

4) 99th Percentile Drawdown

Building upon [3] above, what this output does is effectively list all of the seasonal drawdowns found in the simulations and then takes the 99th percentile figure. It is useful as should a drawdown exceed this 99% figure; it indicates there is a problem or change in the service to be aware of.

What To Look For: We like to see similarity between a tipster’s live record and the results from the Monte Carlo simulation. If a tipster suffers a drawdown that equals or goes beyond this 99% figure – it could suggest a problem.

Recent Examples: We recently analysed a long-term profitable racing system, which over 9 years’ worth of live results had suffered a heaviest drawdown of 109 points. The 99th percentile figure came out at 119 points – suggesting the live tipping history was very similar to the simulation results. A very good sign.

Compare this with our analysis on another racing tipster recently that didn’t attract a high SBC rating. Although their worst drawdown to date was 63 points, the simulations reveal that 139 points would be needed to accommodate the likely potential drop at the 99th percentile. Suggesting that followers of this tipster should prepare for a worse run than that which has been seen in live results.

Read Part 2

Click here to read part 2 of this article, where I cover 8 further outputs from the Monte Carlo simulations including:

  • 50th percentile drawdown
  • 50% bankroll drawdown
  • Likelihood of a losing year
  • Risk reward ratio
  • Capital risk ratio
  • Dispersion factor
  • Sharpe ratio
  • P-values

SBC Helping Inform Your Betting Over The Next Few Months

Whilst there isn’t a huge amount for us to bet on right now, we are using this quiet betting period to publish a series of quality reviews, articles and insightful guides to help deepen the expertise of SBC members.

Mindful of the fact that many of you are using this time without sport to improve your knowledge and understanding of the betting and tipster world, our role is to help fill that gap with informative, educational and quality content.

Tackling everything from helping develop and understand your betting risk profile, the psychology of a winner, Advanced Tipster Analytics and guides to betting on new sports, you can expect to read a lot as an SBC member over the next few months.

As ever, membership comes with a full 30 or 90 day money back guarantee, so if you are looking to develop your betting skills, do consider a Smart Betting Club subscription.

Best regards

Peter Ling

Smart Betting Club Owner and Founder

Another free tipster report from the blogger up over 7k in 2019. Read about his remarkable betting journey…

Today I have another freebie to share with you – a 2nd special report from a blogger using tipsters to turn a profit from his betting.

The author in question is the tipster blogger, Making Punting Pay who in this special report explains how he made a £7,346.57 clear profit betting in 2019.

In this 17 page PDF, you can explore his journey to profit on a month-by-month basis, including the 6 tipsters he follows, the lessons learnt along the way and his advice to those looking to copy his approach when sport and betting return!

Download it now via either of the links below.

DOWNLOAD THIS FREE REPORT PDF

P.s. Make sure you also read the latest posts up at the Making Punting Pay blog on how he performed during Cheltenham 2020 – where he made £6,704.19 over the course of the 4 day festival!

Download Another Free Tipster Report…

If you missed our email last Monday, you might not have seen the other free report now also available for download.

This second report is from SBC writer, Rowan Day on the performance of the tipsters he follows and the profits he made with them during 2019.

Just as with Making Punting Pay, 2019 was another profitable year for Rowan….Providing yet more evidence were it needed that the top rated tipsters we recommend are well worth following.

DOWNLOAD ROWAN’S BET DIARY REPORT PDF

Read More Free From Both These Authors

Although there is very little to bet on currently, it is a great time to read up on some of the excellent material from both these authors on their betting journeys in greater detail.

First of all you can explore more from Making Punting Pay at his regularly updated blog, including his performance so far during 2020. I also recommend going through each week of his blog during 2019 for even more detail on the decisions he made, the challenges faced and overcame.

If you want to read more from Rowan, the author of the 2nd report, you can find posts on his betting progress dating back to 2015 at the free SBC Bet Diary page.

Best Regards

Peter Ling

Smart Betting Club Owner and Founder


How to earn ewallet cashback betting. Download our free guide and start adding extra to your bank

For those of you looking to build in extra profit and edge to your betting, then today I want to highlight how you can use e-wallets to earn cashback when depositing money into your betting accounts.

Whilst your betting income might fluctuate on a weekly and monthly basis, ewallet cashback ticks over whether you win or lose as its based on your staking and turnover.

By taking advantage of e-wallet cashback, those of you betting regularly can easily start to make an extra £100 to £200 per month by following a few simple steps.

Even if you already use an e-wallet with the likes of NetellerSkrill or ecoPayz – you can still earn cashback by following our advice.

So to help you understand more on how easy it is to earn e-wallet cashback, I have put together a simple 7-page guide for you to download on how you can take advantage of this. Click here to download

This free guide also outlines 3 different punters making between £100 and £560 per month simply by following this method and answers all the main questions you might have.


Download SBC’s Free E-Wallet Cashback Betting Guide
Link opens up a free PDF download


All told, it is really very simple to get started and by using this cashback method, you can enjoy a handy income boost each month.

Best Regards

Peter Ling

Smart Betting Club Owner and Founder

1 winner from 41 bets – Why you should follow this tipster

A Bookies Nightmare – that’s the theme of our latest Tipster Profit Report focusing exclusively on several very profitable Horse Racing Tipsters that continue to ride a wave of success.

Yet to balance it out today, and with this recent article on Value Betting firmly in my thoughts, I also wanted to outline a couple of reality checks on life following a racing tipster.

Not a reality check in the form of a worry these top rated experts don’t know their stuff. Because they do – the profits they make are real.

But a reality check in terms of what to expect when following a racing tipster

And the very strong reality that even the best betting experts suffer a losing run.

Because experience tells me that when a punter understands this – it becomes so much easier to follow tipsters and to avoid the one thing that catches most unwary punters out – quitting a tipster at exactly the wrong time.

Handling Losses A Rite of Passage For Any Tipster

One of the biggest warning signs I look for when observing a tipster is if they have never had a losing run of some kind.

In my experience, even the very best experts have losing months.

So if I see a racing tipster in business for 30 months, yet every single month has been profitable – well it sets alarm bells that all is not what it seems.

I wonder “Are these results legitimate?” and often when you dig deeper, they aren’t.

Simply because to go 30 months without making a loss in at least a few of them is unrealistic and unprobable.

It’s important to recognise that just because you pay to follow a tipster – this does not mean that they will not suffer occasional losing runs.

They will and its important to understand this.

Let me show you more with a couple of high-profile examples…


1 Winner In 37 Tips From This ‘Expert’

Firstly, lets use focus on ‘Tipster X’ – which is a very long-running racing service with a major edge.

This tipster has made 3669 points profit @ 12.4% ROI over more than 15,000 bets since 2014.

He knows how to make a profit betting and its been a ‘Hall of Fame’ rated service for several years now.

In our Racing Tipster Profit Report, we reported back on his latest progress since our last update, which saw 138 points profit made @ 26.89% ROI from 138 bets between May and August 2019.

A very nice profit indeed.

Yet, that isn’t the full story as within those 138 bets, there was plenty of ups and downs along the way.

Including a run from the 20th July of 38 bets and just 1 winner, during which this tipster lost 66.88 points.

That is a strike-rate of just 2.6%.

Fancy paying a tipster for that!?

Because had you joined on the 20th July or at some point during those 38 bets, you would have every right to question what took place.

Why was this top-rated tipster giving nothing but losers? After all, SBC rate him in their Hall of Fame and you have spent money to join him!

The reality is that this run of 38 losers was just randomness at play and as long as sticking firm, the rewards would flow as indeed they did.

Of the very next 83 bets advised since this run of losers, the service has made a 143.77 point profit.

Making back the 66.68 points lost and adding another 77.09 points profit on top!

This short-term run of losers was over and in some style and had you quit at the wrong time then you would be kicking yourself right now!

1 Winner in 41 From This 2nd ‘Expert’

To highlight how often this kind of thing happens, another highly rated expert we recommend – lets call him Tipster Y also had a similar bad run of form in August 2019.

During one period, he advised 41 bets and found just 1 winner, losing 22.24 points.

That is a strike-rate of just 2.5%.

Imagine paying for that kind of tipping advice!

Yet, despite this loss, over the 4 month period we covered between May and September, he actually made a total profit of 17.61 points @ 16% ROI from 199 bets.

And when you look back to the first 4 months of the year (Jan to April) he also made 41.04 points @ 53.78% ROI from 138 bets.

So the year is very nicely in profit despite this run of 1 winner from 41 at one point in time.

In total, 2019 sits up 58.65 points profit @ 31.36% ROI from 337 bets

Which once again goes to illustrate the need for patience, even with the best experts.

Have A High Odds / Low Strike-Rate Mentality

One thing both Tipster X and Tipster Y have is a focus on bigger price selections.

During their losing runs, the approximate average odds of a tip put forward by Tipster X was 11/1 and Tipster Y 17/2.

When you are backing at higher odds like this, your strike-rate will always be lower and there will be times when it gets really low as we saw with 1 in 38 and 1 in 41 above.

This is something I will be exploring in more detail in a forthcoming article on strike-rates and what to expect, but for now do be aware that the higher the strike-rate, the greater the likelihood of a losing run.

Whatever You Do – Don’t Quit At The Wrong Time!

I wanted to pen this article today not to scare you from using tipsters, but to just help provide some context on the reality of what to expect at times.

Betting professionally is never PROFIT, PROFIT, PROFIT – there will always be challenging times, yet with both the examples of Tipster X and Y above, you can be reassured that they know how to help you win as they have between them over 20 years of doing exactly that.

What I do want to encourage is the simple notion of having a longer-term and more patient mindset and to disabuse the idea that simply because you pay for tips, you will no longer have a bad run.

I do at times come across some punters unaware of this fact and they are likely the type who will have quit Tipster X or Tipster Y at some point during the losing runs I outlined above.

Which of course is exactly the worst thing you can do as significant profits were just around the corner.

Discover More With SBC

If you enjoyed this article and want to know more about the Smart Betting Club’s work reviewing and rating tipsters, you can read more on this at our Tipster Review Process section.

As that outlines, whether it be a horse racing, football, baseball, golf or tennis tipster under the review microscope – we leave no stone unturned in our quest to examine what is on offer and we focus very much on long-term profits.

Not just what a tipster made just last week or in August, but several years and often thousands of thousands of past bets.

Giving re-assurance that when we say a tipster is good, it really is.

If you like what you read – then you can join the Smart Betting Club at our lowest ever prices for 2019 and all with a money-back guarantee to boot.

Best Regards

Peter Ling

Smart Betting Club Founder

Punting Insight: James Bond, The Professional Gambler? Understanding Value Betting

On a semi-regular basis, I like to deviate slightly from my usual posts and share with you betting articles of interest – those that can help both challenge and educate us as punters.

With that in mind, I have a fascinating article to put to you today, one written by a relatively new tipster we have begun proofing here at the Smart Betting Club by the name of ‘Insider Gambles ‘ on the theory behind successful value betting.

Although a fairly long article, it raises some incredibly useful points that any aspiring punter really needs to understand such as randomness and betting when the odds are in your favour – i.e. value betting.

All of the professional gamblers and tipsters that I have come into contact with use this form of value betting to inform the wagers they place, so understanding it is critical to your ongoing success.

If and when you do have a few minutes spare, please do give it a read as I feel it is the type of article you want to bookmark and return to especially when your betting gets tough.

My thanks to to Mick from Insider Gambles for giving me permission to publish this article. We are actively proofing the ‘Insider Gambler’s’ advice with a view to a detailed SBC review in 2020.

James Bond The Professional Gambler?

What image comes into your mind when you hear ‘professional gambler’?

A James Bond type, suave and handsome, standing at a roulette wheel, martini in hand and a gorgeous blonde draped over his shoulder? He pushes forward a huge pile of chips onto a number, and watches with smug certainty as the ball falls into the right slot…..

This is all absolute nonsense of course.

For a start, James Bond’s favourite game was baccarat not roulette. Secondly, if you shake a martini you chip the ice and just get a watered down drink. Thirdly, neither James Bond nor anyone else in the history of human civilization (fictional or real) has ever been able to accurately predict where the ball will finish on a roulette wheel. A roulette wheel is an efficient random number generator, and the only way to beat it is by having the odds on your side.

So why do successful gamblers win?

How do some investors make loads of money, when most investors lose?

Every successful professional gambler/investor in history has something in common; they bet with an EDGE.

An EDGE is having the odds in your favour. Over time, if the odds are in your favour then you’ll win.

So the reality of professional gambling is somewhat less glamorous than the James Bond fantasy. A pro gambler is much more likely to be found reading a newspaper, or playing with numbers in a spreadsheet than standing in a casino, drinking and flirting with blondes.

The reality of professional gambling is mostly a little dull, and unfortunately there’s no way of explaining the basics that will be a roller-coaster ride of page-turning excitement.

But….if you master the basics it is possible for you to become filthy stinking rich through professional betting.

The Warren Buffett Approach

Just look at Warren Buffett. He leads a frugal, slightly eccentric life, with his head buried in a newspaper most of the time. But depending on what the US stock market has done in the last couple of days, he may very well be the richest man in the world as you read this.

And all Warren Buffett has done his whole life is practice ‘value investing’. He’s a professional gambler. He bets on the share prices of companies. Buys them for less than they’re worth. Sells them for more than they’re worth. That’s it. He understand randomness, he recognises value and he has developed investing methods to turn that value into an edge. You can do it too. Albeit likely on a smaller scale. But theoretically, once you understand how to find an edge there really is no limit to how much you can win.

So think of this article as studying for your O-Level (giving my age away) in professional investing.

Make yourself a cup of tea, settle down and be ready to make some notes. By the end of this article you’ll be ready to pass your exam, armed with the knowledge of how Tony Bloom, Phil Ivey and Warren Buffett made their millions.

Occasionally people manage to win without an EDGE. For example a lottery winner doesn’t have an EDGE. Neither does a guy who flukes a 6 horse accumulator bet. Or someone who buys a company’s shares on spec, just before their shares rocket in value.

Bookmakers, casinos, lottery operators and stock brokers all make a living by selling the dream; ‘it could be you!’. But it almost certainly won’t be. For every guy on the front page of a paper celebrating a £multi-million lottery win there are countless millions of losers. 99.999% of people who buy lottery tickets will make a loss in their lifetime on their lottery ticket investments.

The ratio of winners to losers is broadly similar when you look at people who invest with bookmakers, casinos and stock exchanges. There’s a reason lottery operators get you to tick a box to allow them to publicise you if you win. By displaying you with your winnings, they sell the dream of ‘it could be you’.

Same with big winners at the bookies. The ‘dream’ is what distracts their customers from the reality that the odds are consistently, and hugely against them. The truth that they are overwhelmingly unlikely to actually make a profit; that it ‘will’ be you. Their customers effectively pay a bookie/casino/lottery operator for providing them with a hobby. And a dream.

Professional investors are rare, and they are different. They are not seduced by the dream of a single big win. They take luck out of the equation, and turn the odds in THEIR favour. They get an EDGE.

But how do you get an EDGE?

The process of getting an edge is in 3 Steps;

Randomness – Value – Edge.

This article will explain what that means. How you get to the EDGE. It first involves explaining some theoretical concepts; RANDOMNESS and VALUE. But don’t worry, the payoff for learning the theory comes when you get to the EDGE.

To Be A Good Punter You Need To Understand ‘Randomness’

The first step to becoming a successful investor is to understand RANDOMNESS.

RANDOMNESS is a theoretical concept that you need to ‘get’ before you can move on. It’s invisible, but you have to know that it’s there, and how it works. Like a physicist has to believe in, and understand gravity, even though he can’t actually see it.

Understanding RANDOMNESS is the opposite of believing in fate. Events are not pre-ordained. Events are chaotic, random. Nothing happens ‘for a reason’. Things just happen because events that take place, no matter how small, have an effect on everything around it.

The influence of the laws of cause and effect are at play all around us, every second of every day. Everywhere in the universe. From the moment of the big bang. Anything that can happen, might happen. It will happen, if you wait long enough.

Everything that happens in the universe does so within a framework, the ‘laws’ of how the universe works. The rules of the game. Our best way of describing these laws is with;

  1. The standard model of particle physics
  2. Einstein’s general law of relativity

Essentially the force of gravity and the speed of light are fixed. Everything that happens in the universe conforms to these laws, but what actually happens within the framework that these create is random, chaotic.

There is loads of stuff in the universe, moving around, so it is interacting all the time with lots of other stuff. Even the tiniest event, the briefest collision between the most tiny and insignificant of these can set off a chain reaction that leads to a radically different outcome than would be observed if the tiny event hadn’t taken place.

Ok, enough already with the physics! What the hell has all this got to do with gambling? With sport, poker or the price of a company’s shares?

Everything.

Because games of sport, hands of cards and the economies of the world all work in the same way as the universe, fundamentally. There are rules. And there is randomness. That’s all.

Take a football match. The rules are fixed. There will be 22 players, a referee, a rectangular field and 2 sets of goals. The referee will blow his whistle and the players will start to play.

What happens over the next 90+ minutes on that rectangle is random.

There is a discernible and predictable pattern to the randomness for sure. We can know that it’s likely that the better players will play better. The team with more of the better players is more likely to win. The number of goals scored is most likely to be between 2 and 4. Etcetera.

We can know these things, these ‘likelihoods’, by observation and research, considering data on previous similar occurrences, i.e. other football matches, especially those involving these teams and these players.

But what we can’t do is predict EXACTLY what will happen.

From the moment the referee blows his whistle to start the match there are a virtually infinite number of possibilities of how the game might play out. Every decision a player makes, every spin and deflection of the ball, every instruction given by the coach, each breath of wind, every noise from the crowd that the players hear, every decision by the officials….they all come together to create a narrative, a story on a timeline across the 90 minutes that describes exactly what happened. And if you played the match a trillion times, the story would never be exactly the same twice.

This is because every variable is multiplied by every other variable to come up with the total number of possible storylines.

In the infinite number of storylines a % of them will result in the score ending nil-nil. A different % will be 1-nil, 2-nil, 3-1 etc. A much smaller % will result in the score ending 8-4. If it’s possible that it can happen, it will happen, even if it’s a tiny % of the time.

Every possible outcome will be included in the % distribution of different scorelines that result from our infinite number of storylines. We can look to this distribution to observe the implications of the rules of the game, the framework within which it operates.

None of the storylines will end up yielding a score of 5,000-nil. The rules of the game are that you play for 90 minutes (plus a bit more) and that after a goal the ball gets placed back on the centre spot. The clock continues to run while the ball is returned to the middle. So there isn’t enough time for a team to score 5,000 goals in a football match. That possibility exceeds the framework of the game established by the rules, so it will never happen. Nothing will ever travel faster than the speed of light.

In our infinite number of football match storylines the upper end of the total number of goals scored might by something like 60. Incredibly, mind-bendingly rare though such a match might be – it is possible that one match could yield 60 goals. And if it’s possible that it could happen, then it will happen. Eventually.

Nothing will ever travel faster than the speed of light. That is one of our laws of the universe. Things can and will travel at any speed up to and including the speed of light, but nothing over that.

Value Betting Is No Guarantee ‘Something Will Happen’ (Or A Bet Will 100% WIN)

So what are the practical implications for a professional gambler of understanding this RANDOMNESS theory?

First, you understand that fundamentally predictions are useless. It is impossible to predict exactly what will happen because the number of actual possible storylines is infinite.

But it is possible to guess at the pattern of likelihoods in advance. That is the best we can do, and it what we must do.

We know that, within the framework, all the things that are possible will occur a certain % of times. The job of the professional gambler is to discern the pattern in the RANDOMNESS.

To say ‘how likely’ something is to happen. Not to say what ‘will happen’.

Where the subject involves animate objects, like the players, officials, fans, pitch and weather of a football match then the pattern in the RANDOMNESS cannot be projected precisely. It involves an element of guesswork. Observation, such as watching previous matches involving the teams, or analysis by looking at a league table can make the guesswork more accurate than a guess plucked from thin air. Modelling the relative strengths of the teams and the players using sophisticated analysis, and then feeding that into an engine which works out a distribution of possible scorelines can get you pretty close to projecting the % distribution within the infinite storylines. But it’s still guesswork, even when it’s very informed guesswork using a computer model.

But where the subject involves an inanimate object such as a roulette wheel or a drum of lottery balls then we can be can be absolutely precise in discerning the patterns in the RANDOMNESS. So long as the roulette wheel (let’s use a European wheel here with a single 0) is well made, and working properly then the % distribution of the ball falling into each slot will be 2.7% over an infinite number of spins of the wheel.

It will be 2.7% in slot 0, and exactly the same % in slots 8, 13, 28, 31….. The % distribution of the ball falling into a slot numbered 57 will be 0%. The framework of a roulette wheel is defined by the rules of how many slots it has. Our wheel has 37 slots, so the number of times a ball will fall in a slot other than one of these 37 is the same number of times our football match will have with 61 goals. And the same as the number of times an object will move faster than the speed of light. Zero.

When two boxers get in a ring the better fighter will normally win. But the rules of the ring dictate that either fighter could win. So there doesn’t have to be a ‘reason’ why Buster Douglas knocked out Mike Tyson. Randomness means that it was inevitable that it would happen at some point, if you iterated that fight over many times. It just happened to be that night.

When a roulette wheel spins it is randomness that governs which slot it falls into.

There is no memory to the wheel, no number is ‘due’ to come up just because it hasn’t come out for ages. In 1913 in the Monte Carlo Casino the ball in a roulette wheel landed in a black slot 26 times in a row. The odds of that happening were over 67 million to 1. So while it was surprising to the onlookers (and ruinous to the ‘red backers’!) the sequence was actually no more surprising than any of the other 67 million possible storylines that the 26 spins could have produced.

So the point of learning the theory of randomness is to realise that predictions are useless to a professional gambler, because they are impossible.

It is impossible to see into the future. It is one of the immutable laws of nature. Part of the framework.

We need to understand that our job is to discern the patterns in the randomness. To say how likely something is to happen. Not to say what we think will happen.

Once we understand this principle we can move on to VALUE.

Value Betting – The Odds In Your Favour

VALUE mean finding investment opportunities where the odds are in your favour.

VALUE is backing something with a 50% chance of happening at odds of 11 to 10.

If anything can happen. And we can’t know what is going to happen. How can we profit from betting on something that is going to take place in the future?

The answer is that all you need is to be armed with an idea of how likely something is to happen. And then, to know that the chance of it happening is greater than the odds you get when you make your investment.

It’s all about the odds.

An investment is risking something in the hope of a profitable return. The profit you make when you win, divided by the amount you risked are the odds.

So if you bet £100 on a horse, and it wins, and you get £400 back then your profit was £300. 300 over 100 is 3 over 1. Your odds were 3 to 1.

On this occasion the horse won. But how likely was it to win? If we ran the race a million times, on how many occasions would our horse win? What is the pattern in the distribution of the randomness? Lets say out of a million races our horse wins 200k times. The pattern in the randomness is that our horse’s true chance of winning the race is 800k over 200k. Or 8 over 2, which is 4 over 1. 4/1 are the horse’s true odds.

If we bet a million times on our horse at 3/1 we would lose money. We would get back £800k having staked £1m. Our loss would be £200k. 200k is 20% of 1m. 3/1 is ‘bad value’ for that horse, to the tune of 20%.

But if we could get 5/1 about the horse the sums become £1.2m return on our £1m stake. The horse becomes Value, at 20%.

When I say the ‘horse’ becomes value, I don’t really mean the horse. I mean the odds of 5/1 are value. Where odds of 3/1 are not. The horse is, effectively, irrelevant. What matters is the odds that you get, not the horse itself. Every horse, no matter how slow has a chance of winning any race that it lines up for. Those are the rules. That is the framework that we are operating in.

So if a horse is so slow that it will only win 1% of the time then its true odds are 99/1. If you can bet on that horse, slowcoach that it is, at odds of 100/1 or better then it’s a Value bet.

What happens in the race on any single occasion doesn’t make the bet a bad bet. Single results don’t prove whether something was value or not, whether it was a good bet to make or a bad bet.

The truth of value investing only reveals itself over time.

There’s a paradox that gamblers have to get their head around. The difference between short term and long term. The only thing matters is winning overall, in the long term.

But winning on any one single occasion barely matters at all.

Value investing is a war waged though a series of many, many battles. Winning or losing any single battle does not really matter. Looking back on all the battles, from a position of triumph having prevailed in the war, the fuss that you made about the loss of any single battle will seem ridiculous.

Value investing is nothing to do with trying to win every battle. The only thing that matters is having the odds on your side consistently as you fight the battles, so that as a the results of a great number of battle becomes known your superiority becomes apparent.

Even great football teams lose some games. The best poker players regularly lose loads of hands. The best investors buy shares in companies who go bust. The best golfers make bogies. Champion jockeys lose far more races than they win. Short term losses are ultimately irrelevant. All that matters is long term overall victory.

So this is the concept of value; investing with the odds in your favour.

There is a neat, simple mantra for any professional investor to adhere to; Decisions Not Results.

If you keep making the right decisions, keep betting with the odds in your favour, keep finding Value then as long as you stay in the game for the long term you will end up a winner.

/////////////ARTICLE ENDS///////////////

I hope you enjoyed this article – if you have any feedback on it, please do share your thoughts with me via email – pete@smartbettingclub.com

Peter Ling

Smart Betting Club Editor

Should you bet to win or each way at Betfair SP? A new spin on this age-old question

Monday saw the release of the latest SBC review and the first in our series on profitable betting exchange tipsters as we honed in on the racing guru showing a fine profit at both Betfair SP and bookmaker prices.

Yet as profitable as this service is, one of the dilemmas our review threw up was the old query of – should you back a horse to win or each way?

Its a question as old as betting on racing itself as punters weigh up whether to go for broke and the big win OR to play it safe and get a payout of some kind should the horse finish 2nd, 3rd or 4th.

What is new is understanding which approach you should take when betting at Betfair SP as the each way market on the exchange is split into two – you bet into the win market and the place market separately.

Posing the updated question…

If betting at Betfair SP, should you back a horse to win or in both the win/place markets?

Allow me to help explain how we approached this dilemma in this new review…

Win only betting returns the highest points profit

Without question, the most profitable angle to follow this particular racing tipster from a points profit basis is to bet on each horse to win outright.

To outline this, below you can see the performance if backing win only at Betfair SP (after commission is deducted):

Betfair SP win only: 827 bets, 430.44 points profit @ 14.25% ROI

And then comparing that with mixing up win and place bets as directly advised by the tipster himself:

Betfair SP win/win & place mix: 827 bets, 290.68 points profit @ 9.63% ROI

On the face of it, this looks an open and shut case. Back all the tips to win and leave it at that.

Yet when we dig a little deeper, things turn out a little differently…

Next step – analysing the worst ‘drawdowns’

What the above doesn’t take into account as that bane of all punters everywhere – losing runs and specifically from our point of view, working out the worst drawdown from peak to trough.

Explained another way, a drawdown is an understanding of what the worst possible run you might suffer actually is….Should you be extremely unlucky and choose to follow this tipster on the very day they start their worst losing run.

Such drawdown figures are essential to understand because just as we always ask a tipster ‘what can i make?’ – we also need to ask ‘what can i lose?‘ should the worst happen.

Without hindsight its impossible to know when a bad run will actually hit – all it can really do is prepare you and make sure you have a bankroll to cover the worst eventuality. And if you think that losing runs don’t happen to us all, even professional punters when betting, well, think again…!

Here then are the worst drawdowns for both the win and win/place method:

Betfair SP win only worst drawdown: 154 points

Betfair SP win/win & place mix worst drawdown: 132 points

If these seem large, don’t be worried as the losses during each of these drawdowns were more then recouped simply with patience and time. No tipster, no matter how good they are is ever invincible and ALL go through drawdowns and losing runs at some time.


The method with the biggest ‘bank growth’

With the above ‘drawdown’ figures alongside the results of our in-house montecarlo simulator (which repeats the profile of each tipster several thousand times), we are then able to come up with an advised betting bank figure for each method.

This betting bank is designed to absorb drawdowns – thus ensuring you never go bust!

For the win only betting approach, we naturally need larger betting banks to cover larger possible drawdowns than the win/place method. And from this information, we can gauge exactly how much betting bank growth (or Return on Capital) we can make per method.

Here is how the 2 approaches stack up from a bank growth perspective:

Betfair SP win only: 142.04% Growth

Betfair SP win/win & place mix: 145.34% Growth

From this we can clearly see that its actually betting in both the win and place markets (effectively each way bets) which produces the most betting bank growth in this scenario. It’s only an extra 3.30% growth but every little counts.

This is because you need a much smaller betting bank if following win & place then if following win only.

And it is this higher bank growth figure you should focus on – not simply always just ‘points profit’.

Individual tipster analysis required

Although in this example, the greatest bank growth came by betting in both the win/place markets rather than win only, this is not always the case.

Such analysis needs to be performed on a tipster by tipster basis as each strategy is different and you need to understand them fully to really maximise your returns.

As ever – putting the profits made by any tipster into context is key – especially when it comes to betting banks

Which is why we pen these detailed reviews to help you maximise the revenue you can make by following any given tipster. We also perform the above analysis on all tipsters reviewed as standard.

If you would like to know more about the Betfair SP tipster featured in this example, you can access our detailed review the instant you join the Smart Betting Club.

You can sign-up today at our lowest prices ever – from just £27.99 + VAT per quarter, which provides you with the ENTIRE Smart Betting Club service including all our SBC Magazine, Tipster Profit Reports, Best Tipster Guides, Pro Betting Guides & more.

It’s our best ever SBC membership deal and with our amazing money back guarantee offer you have everything to gain and nothing to lose.

Best Regards

Peter Ling

Smart Betting Club Owner and Founder

Subscribe NOW to the Smart Betting Club.

Pete_HeadShot_SMall

What’s better – The number of winners you back or how much you win?

Today, I want to share with you a fascinating article recently published by a friend of mine from the betting world – Matthew Walton, who raises some very important points that all aspiring profitable punters need to be aware of

Matthew delves into the battle between strike-rate and profit and the real-life mental challenges that occur when using tipsters, especially those that select bets at big odds and to low strike-rates.

Like Matthew, I have seen far too many punters quit a good tipster all too early because they suffered more losers then they could handle. Despite the fact that when a bet did win, it won big.

There is no shame in falling foul of this especially when you consider the pain of a losing bet is twice the joy we get from backing a winner.

It’s a psychological test – all of which makes it vitally important that as punters we absorb as much information as possible from experts like Matthew. After all, he knows what it takes to win long-term, which is of course what matters most.

So, without further delay – over to Matthew…

What’s better, strike rate or profit?

Which is more important… the number of winners or how much you win?

This is something which I have thought about, spoken about, and written about A LOT!

Because over the many, many years I have worked in this business, some of the most common questions I get asked by new members or, more often, punters who are considering becoming new members, are along the lines of…

What’s the strike rate of your best racing tipster?

And

How much profit did your best football tipster make last week/month?”

Don’t get me wrong, both are sensible questions. And both are well worth asking of me, or any other service you care to take an interest in joining. Because you need to know if Service X has the kind of strike rate you’re comfortable with, or whether Service Y will actually make money from soccer betting.

You need to know these things.

And they’re questions that I would ask myself when doing my due diligence on any new football tipster, or horseracing expert, who tugs my coat and tells me they’re the next big thing when it comes to making money at football, or beating the bookies at racing.

They are fundamental to whether you (a) join and/or (b) stay with a service.

And you should ask yourself the question right now, if you haven’t already… which would you prefer? Or rather, which order would you put them in.

Stupid question, it’s obvious…

Profit, right?

We all bet to make money, primarily. And the more we make, the better.

So if it’s a case of sacrificing a few percentage points in terms of strike rate, in order to generate a bigger overall return… it’s a no-brainer. You should take the cash every time.

Well, you say that. But I know from experience there’s a flipside to this argument.

Take these two notional services… Service 1 has a 10% strike rate but returns a 40% Return on Investment (ROI), whereas Service 2 has a 40% strike rate but returns a 10% ROI.

I know from working in this business for more years than I care to remember, the majority of punters would actually stick with Service 2 longer than Service 1.

What?? That’s absolute rubbish!“… I hear you cry.

Not so.

Whilst most backers would like to win more money (and I agree with that, who wouldn’t), crucially the manner in which that profit is made also must be to their liking.

And as such, low strike rates, which sap confidence (from some, not all), which clean out betting banks (only of those who don’t budget properly, or stake erratically), and test the patience to breaking point (yes, of the less savvy punters)… these low hit rates cause many to throw in the towel, and often far too quickly.

Which means even though a bigger payday is waiting for them, somewhere down the line, they’re simply not able, or are not prepared, to wait for it to arrive.

Believe you me, I have seen this time, after time, after time.

Take one top golf tipster that I work with, which the guys at SBC recommend… a proven profit-maker that has made 500+ points profit to level stakes in 5 years (Yes! He has generated an average profit of around 100 point per year to level stakes).

I’ve seen this service ditched because it didn’t deliver “certain members” enough winners in a short space of time – in other words, the strike rate was too low. As a result it is kicked into the long grass because a member has grown impatient, spent up their insufficient funds, or simply lost confidence (in what has already been proven to be a long-term profit maker).

But the point is, the average price of these golf bets is around 80/1.

You’ll never get a high hit rate backing golfers at 80/1. Never.

But you will make a long-term profit if you back enough of them when they are assessed to be over-priced (which is exactly what the Golf Insider does).

This service has an ROI in excess of 20%… but the low strike rate is seen (incorrectly, I argue until I’m blue in the face) as a negative, when it shouldn’t be. Not if you get your staking correct and your mindset right.

You can’t handle the truth!

Of course, when someone joins one of the tipsters I work with, they do so with the goal of making money from horseracing or to win big at golf betting… I offer them some initial advice on the importance of a betting bank, and a sensible staking plan, and a degree of level-headedness when it comes to results… and they all nod their heads in agreement.

But throw in the curve ball of a few losers…

Even though they are to be expected with the service they’ve joined (or any other betting service for that matter)…

And it’s panic stations! Needlessly.

As I often say in the office, mis-quoting Tom Cruise in the film A Few Good Men

You can’t handle the strike rate!

And this is something which actually ends up hurting the member themselves in the long run. Because they’re the ones who head for the exit, when if they’d stayed longer, the winners (and profits) would have fallen into their lap.

But strike rates aren’t everything

I totally agree.

I’ve seen services, and this is often the case with football betting syndicates, or laying services on the horses, where the strike rate is higher than, say, a standard horseracing operation or a golf betting cartel… but the ROI is half, a third, maybe even a quarter of the amount on offer with those other services.

And when you factor in costs, it means you either (a) have to stake big, big amounts to make any money or (b) you stake within your own comfort zone and end up with a membership that breaks even, or makes just a few points profit after months of subscribing.

Unless this is a service offering exceptional betting bank growth or Return on Capital – something that only occurs with a few very high volume tipsters, then the above outcomes are not what you want from your betting.

Because you want to show a healthy profit for your efforts… we all do.

And if you get too hung up on the number of winners you’re going to back with a service, or how many bets there were in its longest losing run, or what’s the biggest drawdown of funds it has endured… all to the detriment of the “elephant in the room” (i.e. how much profit a service makes)… then you could easily miss out on a nice little profit-generator.

I think of an example like the Scottish Football Tipster I work with which has a strike rate of close on 46%. This means members can lump on the bets safe in the knowledge that almost every other bet will be a winner… great!

But the flipside is the ROI on this service is nearer the 15% mark. That’s less than the my golf expert.

However, members tend to stick with the Scottish Football Tipster longer. Why? Because it simply provides then with more winners (also, let me add, it’s because a 15% ROI betting on football is a truly exceptional level of performance. Better than you’ll find anywhere else on any other soccer service).

So reverting back to the original question, would you prefer a high strike rate or bigger profits? As sadly you rarely get both!

Is it all down to your risk profile?

Most likely. It all boils down to what kind of punter you are, how prepared you are to accept a few losers, how much “bottle” you have when funds appear to be ebbing away, and whether you can keep faith in a proven service when it’s not necessarily firing on all cylinders.

From my perspective, and as stated above, you might get a service that has a low strike rate and low profits (we’ve all seen those, right?) but you will never see a service which has a high hit rate and a good level of profit. Certainly in terms of ROI anyway. They are as rare as hen’s teeth, unicorns and rocking horse poo.

So what I try to look for are services which deliver the best of both. Ok, a lower strike rate than some… but still a higher profitability than others. Or maybe a shade more winners, traded for a scrap less return.

And that sweet spot should provide you, the prospective member, with the best of both worlds. Enough winners (relative to the average price) to keep you happy, but enough profit to make sure the service – whether it be golf, horseracing, football or greyhounds – more than pays its way.

OPINION: You have every right to expect the service you’re joining to make as much profit as possible. But do not make the mistake of falling for the horseracing service, or football syndicate, that boasts the highest figure… because the way it generates that return (e.g. backing big-priced bets with a low strike rate) might not sit well with your own personal way of betting. But by the same token, if a service freely advertises that it only tips long-shots (but does make money doing this) then make sure you give it due time and opportunity to deliver. Because backing at an average price of 80/1 doesn’t produce the same strike rate as backing at 6/4… sad, but true!!

Get The Professional Betting Fundamentals

My thanks to go to Matthew for granting me permission to share this article with you all and I hope you found it as useful as I did.

As Matthew alludes to – much of the battle to become a winning punter takes place in the mind and a greater understanding of the challenges we face when betting, can help us dramatically improve our bottom-line profit and loss figures.

All of which is why we provide all new Smart Betting Club members with access to our Pro Betting Fundamentals – featuring 2 key reports to help you think and act like a professional, profitable punter.

Whether it be the tools and expertise to get your betting setup professionally OR the mindset you need to be a winning punter, these guides will help you every step of the way.

Subscribe NOW to the Smart Betting Club.

Peter Ling
Smart Betting Club Editor

Pete_HeadShot_SMall